
This case study walks through the repeatable four-phase process we use to diagnose and fix failing feeds, applied here to a mid-size ecommerce with 10,000+ products. It applies to any vertical.
The core problem: The client’s feed was built around internal warehouse logic (model names, SKU conventions) instead of how customers search.
Before touching anything, we asked: What’s the gap between how we’re describing products and how customers are finding them?
What We Did: Four Phases
Phase 1: Title Pattern Audit
We picked 20-30 of the client’s best-sellers and searched them on Google Shopping.
We studied what competitor titles included in the first grid:
- what details were they leading with?
- what was missing from ours?
The client had the data but wasn’t surfacing it, internal model names like “- Priverno” were taking up space where material, dimensions, or seat count should go.
We documented the pattern gap, tested new title patterns on a small sample, then scaled the approach.
Phase 2: Category Taxonomy Alignment
We downloaded Google’s official Product Type Taxonomy and mapped it against the client’s categories.
What we found: they were using generic parent categories (“Furniture” ID 436) when specific leaf nodes existed (“Furniture > Bedroom Furniture > Sofa Beds” ID 3966).
This mismatch was causing disapprovals and limiting how Google filtered products.
We built a corrected mapping and uploaded it via supplementary feed, no website changes needed. The specificity immediately prevented hundreds of mis-categorizations.
Phase 3: Attribute Completeness
We went back to our Phase 1 analysis and looked at competitor titles.
Material showed up in 90%+ of them. Size variants in 80%. Mechanism in 70%.
We checked the client’s feed: material was missing on 95%+ of sofas, sofa beds, and sideboards.
The data existed on product pages, in the CMS, in supplier sheets but wasn’t in the feed.
We added the core missing attributes at the source and prioritized high-volume categories.
Phase 4: Disapproval Cleanup
We exported all disapprovals and grouped them by issue type:
- missing price
- unable to view on mobile
- price mismatch
- etc.
For each group, we determined if it was a feed problem, website problem, or data sync issue.
We tracked everything systematically.
This phase came last because most disapprovals were symptoms of the structural problems we’d already fixed, broken taxonomy, missing attributes. Once structure was corrected, cleanup was straightforward.
The Results
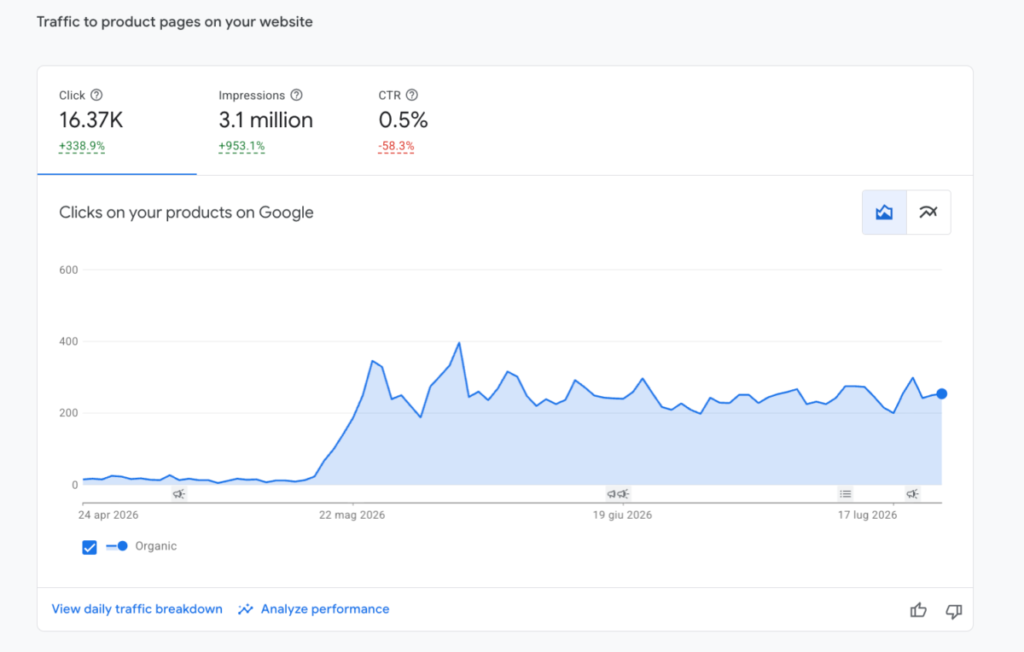
Implementation timeline: late April to mid-July 2026.
Clicks on product pages: 16.37K clicks, up 338.9% from baseline.
Impressions: 3.1 million, up 953.1%.
The trajectory is visible in the chart: clicks climbed from near-zero in late April to a sustained 200-300 daily by mid-July, with spikes to 400+. Impressions followed.
My services are highly personalised to each client.
Some services I offer: